
Team Insights
Team Insights is Teamio’s live follow-up scoreboard. It answers the questions a morning huddle keeps asking: How many patients did we reach out to? How many of those got scheduled? Who’s doing the calling, and how often does it convert? It’s the on-screen counterpart of the Team Insights sections in the automated email reports.
Open it from the left sidebar — Team Insights (the wand icon) — or go to /app/team-insights.
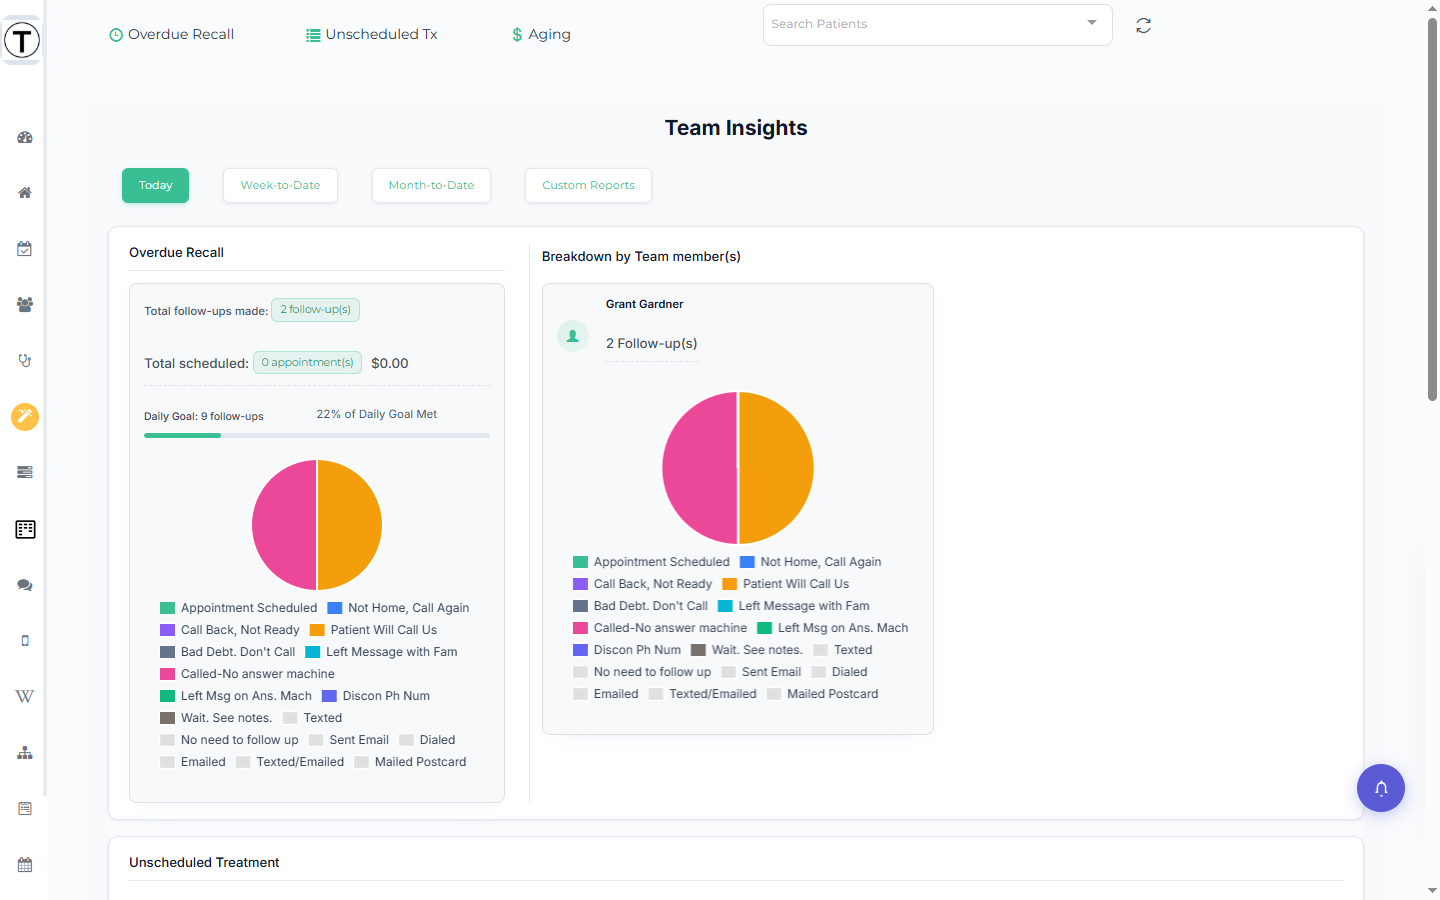
The three time tabs
Section titled “The three time tabs”Across the top are three tabs that change the period every card reports on:
- Today — activity for the current day, measured against each list’s Daily Goal.
- Week-to-Date — Monday through today, with Conversion Rate added to each team member.
- Month-to-Date — the 1st of the month through today, also with conversion rates.
Switching tabs reloads the same set of sections for the new period.
What each section shows
Section titled “What each section shows”Every tab is organized into the same sections, one per follow-up list:
- Overdue Recall
- Unscheduled Treatment
- Aging — an inner tab bar with Outstanding Claims, Pre-authorizations, and Patient Balances
- Broken Appointment Follow-ups
Within a section you’ll see:
- Total follow-ups made — a clickable count button. Selecting it opens a Follow-up(s) made popover listing every patient contacted, with columns Patient (or For Patient on claims), Followed-up on, and Team member. (Click elsewhere to dismiss — the popover is focus-triggered.)
- Total scheduled — another clickable count whose popover lists the patients who were scheduled as a result.
- A goal progress bar — on the Today tab it reads Daily Goal: N follow-ups with a % of Daily Goal Met figure; the weekly and monthly tabs track the corresponding goal.
- A pie chart summarizing the section.
- A Breakdown by Team member(s) card slider — one card per employee. On Week-to-Date and Month-to-Date, each card reads N follow-ups - X% Conversion Rate, so you can see not just who made the most calls but whose calls convert.
The Aging → Outstanding Claims section is framed around claims rather than appointments: it tracks Total calls made and Claims received from follow-ups instead of scheduled.
Custom Reports — any month range
Section titled “Custom Reports — any month range”For a window other than today, this week, or this month, open the Custom Reports tab (it takes you to /app/team-insights-custom-reports). The page is titled Team Insights - Custom Reports.
- Set From: — pick a month and a year.
- Set To: — pick a month and a year.
- Select Apply Filter.
A Loading Reports overlay appears while the data is fetched (the query is read-only). The results repeat the familiar sections — Overdue Recall, Unscheduled Treatment, Outstanding Claims, Broken Appointment, Pre-authorizations, and Patient Balances — each with Follow-up(s) made / Appointment(s) Scheduled pie charts and a Breakdown by Team member(s) card for the whole range you chose.
Reading the numbers well
Section titled “Reading the numbers well”- Watch conversion, not just volume. A team member with fewer follow-ups but a higher Conversion Rate may be scheduling more patients per call — use the per-member cards to coach.
- Set the goals first. The progress bars are only useful once a Daily Goal is set on the Overdue Recall and Unscheduled Treatment lists.
- A locked section isn’t broken. An Access Restricted card means your role doesn’t have that list’s permission, not that there’s no data.