Treatment Presented vs Accepted
Case acceptance is the ratio of how much treatment has been accepted compared to how much treatment was diagnosed — presented — to the patient. Teamio calculates it from your live Open Dental data and shows it on the Treatment Presented vs Accepted report, so you can see whether the treatment you diagnose is actually turning into booked appointments.
Where: Sidebar > Today’s Huddle (/app/huddle) > View Tx Presented vs Accepted in the page header.

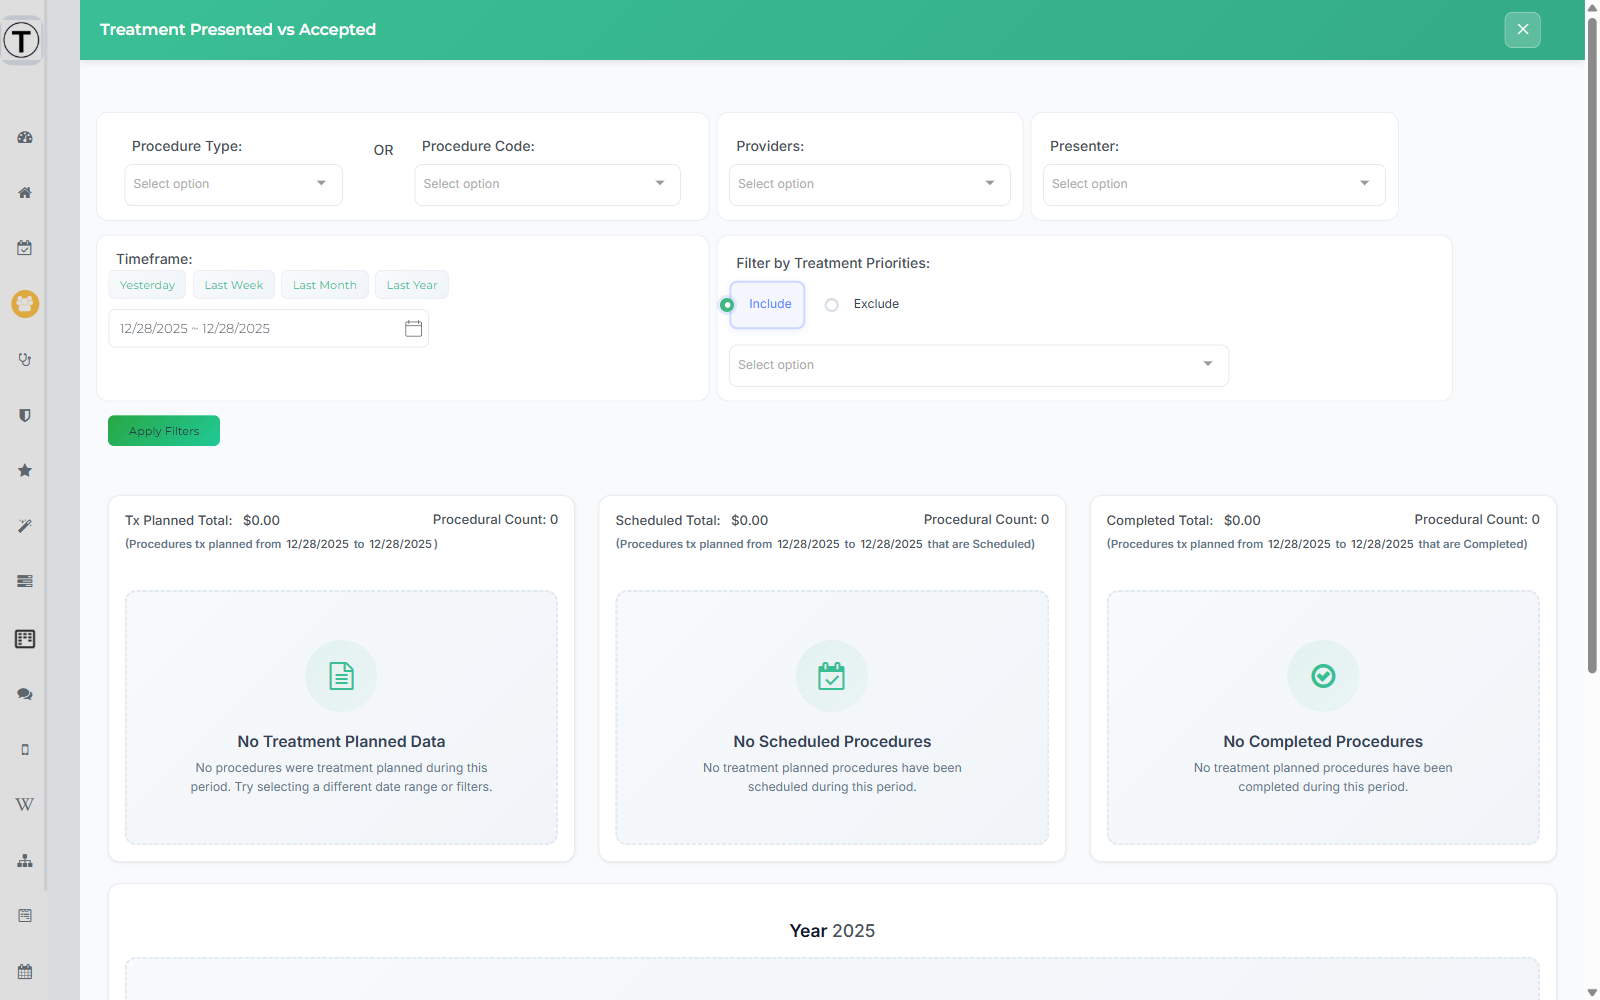
The button opens a full-width slide-out panel titled Treatment Presented vs Accepted. It opens on month-to-date — the 1st of the current month through today. Close it with the X in the green header.
What does “accepted” mean?
Section titled “What does “accepted” mean?”A treatment is considered accepted when the treatment that was diagnosed is either scheduled or completed.
Mechanically, Teamio looks at the Open Dental appointment that each planned procedure is attached to. If that appointment’s status is Scheduled or Completed, the procedure counts as accepted. Everything else counts as presented but not accepted, including:
- the procedure has no appointment attached at all
- it sits on the unscheduled list
- its appointment was broken
- its appointment is only planned
What counts as “presented”?
Section titled “What counts as “presented”?”Presented treatment is the procedures you’ve recommended for a patient and entered into their chart in Open Dental. To land in this report, a procedure must:
- have Open Dental status TP (treatment planned) or C (complete);
- have a fee greater than zero — zero-fee procedures never appear; and
- have a treatment-planned date inside your selected timeframe.
Diagnostic and preventive codes are deliberately left out — exams, x-rays, and prophys aren’t “treatment” you present. On the US CDT code set that means D0… and D1… codes are excluded, except sealants (D1351) and fluoride (D1206, D1208), which are included.
The formula
Section titled “The formula”(Total $ amount of treatment accepted ÷ total $ amount of treatment presented) × 100
Two things about that formula are worth being explicit about:
- It’s measured in dollars, not case counts. Ten accepted fillings and one declined implant is not 91% acceptance.
- The denominator includes the accepted work. Scheduled and Completed are slices of Tx Planned, not additions to it — which is why Scheduled + Completed will never add up to Tx Planned unless your acceptance is 100%.
The three totals
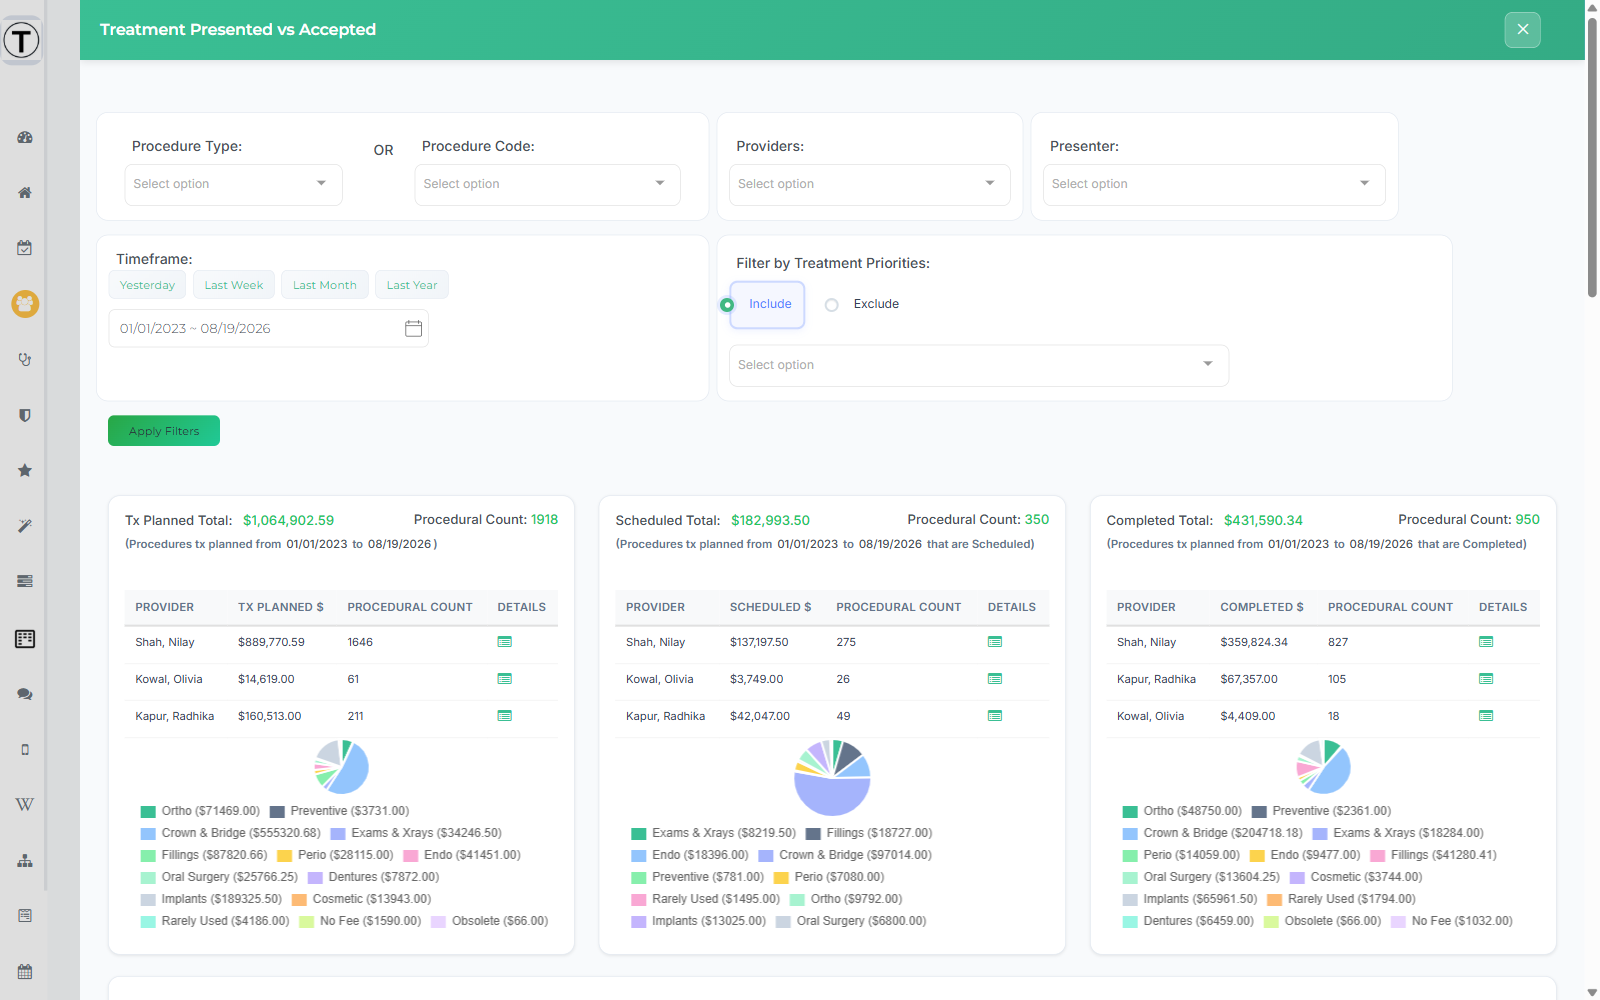
Section titled “The three totals”The report shows three cards side by side. Each one has a headline dollar figure, a Procedural Count, a per-provider table, and a pie chart breaking the dollars down by procedure category.
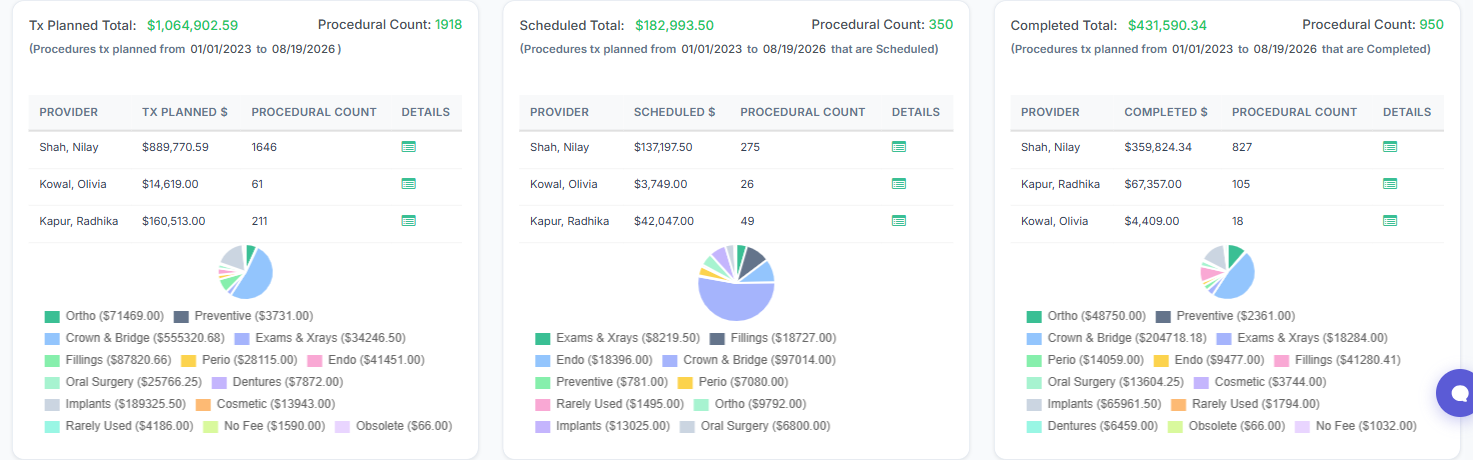
- Tx Planned Total — everything presented in the timeframe. (Procedures tx planned from {start} to {end})
- Scheduled Total — the slice whose appointment is Scheduled. (… that are Scheduled)
- Completed Total — the slice whose appointment is Completed. (… that are Completed)
Scheduled and Completed never overlap. Add them together and you have your accepted dollars; subtract that from Tx Planned and you have the treatment still sitting there.
In the example above: $1,064,902.59 presented, $182,993.50 scheduled and $431,590.34 completed. That’s $614,583.84 accepted — about 58%, and roughly $450,000 of diagnosed treatment nobody has booked yet.
The pie legend labels read Category ($amount), and the slices are sized by dollars, not by procedure count. A single implant case can outweigh forty fillings.
Drill down to the patient
Section titled “Drill down to the patient”Select the Details icon on any provider row to open a patient-level list for that provider — titled {Provider} - Tx Planned Details, - Scheduled Details, or - Completed Details depending on which card you’re in.
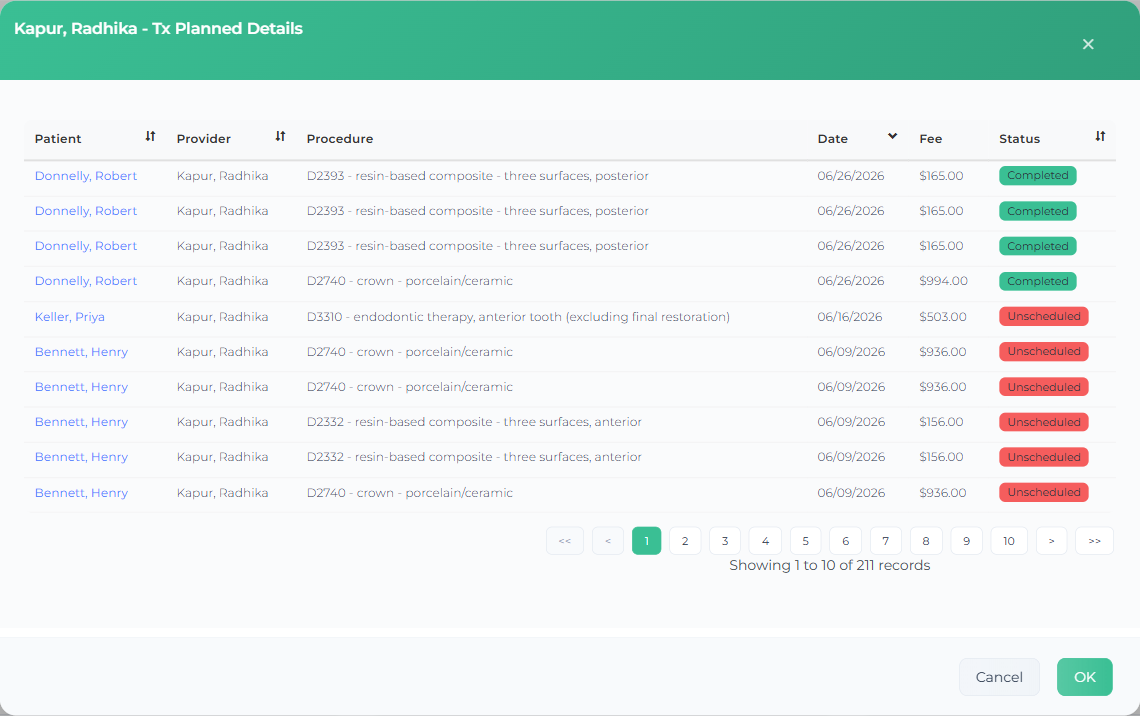
Each row shows Patient (a link to their patient page), Provider, Procedure, Date the treatment was planned, and Fee. The Tx Planned Details list adds a Status badge — the Scheduled and Completed lists don’t need one, since everything in them shares a status:
| Badge | Means |
|---|---|
| Completed | The appointment is done — accepted |
| Scheduled | The appointment is on the books — accepted |
| Unscheduled | No appointment attached, or the appointment was broken or left unscheduled — not accepted |
| Planned | An Open Dental planned appointment — not accepted |
Rows page 10 at a time, newest planned date first. Patient, Provider, Date, and Status are sortable — sort Tx Planned Details by Status to group the Unscheduled rows together, and you have your call list.
Patient acceptance
Section titled “Patient acceptance”The acceptance percentage above is measured in dollars. That is the right number most of the time, and the wrong one in a specific, common case:
You plan ten crowns for a patient. They schedule two of them, and tell you they’ll do two a month until it’s finished. Your acceptance for that patient reads 20% — even though they said yes and are actively working through the plan.
Patient acceptance answers the other question: of the patients you presented treatment to, what share scheduled at least one procedure from it?
(Patients who scheduled at least one procedure ÷ patients presented treatment) × 100
In the example above, dollar acceptance is 20% and patient acceptance is 100%. Both are true. Read them side by side:
- A low dollar percentage with a high patient percentage means people are saying yes but starting small — phased plans, budget conversations, one quadrant at a time.
- Both low means people are leaving without booking. That is a different problem, and a more urgent one.
Who moved forward
Section titled “Who moved forward”Underneath the totals, every patient who was presented treatment is sorted into three groups:
| Group | Means |
|---|---|
| Scheduled all of it | Every procedure they were presented is booked or done |
| Started, not finished | They booked some of it — the phased-plan patient above |
| Nothing scheduled | They booked none of it |
Started, not finished is the group the dollar percentage hides. The row shows how much of that treatment is already on the schedule against how much was presented, so you can see the difference between “nobody is saying yes” and “everybody is saying yes slowly.”
Select any of the three rows to open the patient list for that group. Nothing scheduled is your follow-up call list.
Why recall visits don’t count
Section titled “Why recall visits don’t count”Booking a cleaning is not accepting treatment. If a patient is shown a crown and a root canal, books neither, and schedules only their next hygiene visit, they should not read as having started treatment — so patient acceptance ignores recall procedures entirely.
Teamio uses your own recall setup in Open Dental to decide what counts as recall — the procedure codes on each of your recall types, typically prophy, perio maintenance, fluoride, exams and x-rays. Nothing is hardcoded, so custom codes and non-US code sets work the same way.
Two consequences worth knowing:
- A patient who books only recall work counts as having started nothing, no matter what that visit is worth.
- A patient whose entire presented plan was recall work is left out of the percentage altogether. They were never offered treatment to accept, so counting them as a failure would be misleading. The report shows how many patients were set aside this way.
Filters
Section titled “Filters”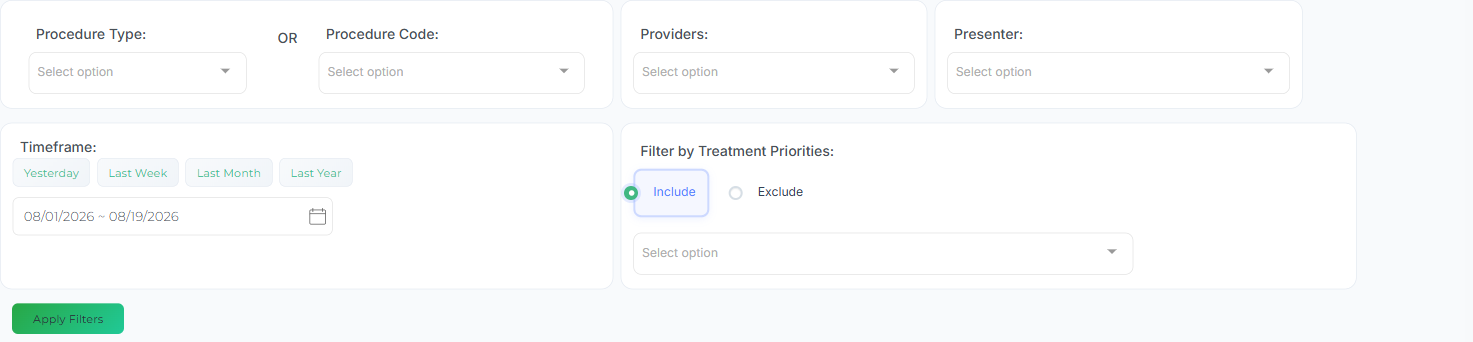
Set what you need, then select the green Apply Filters. Nothing changes until you do.
Procedure Type or Procedure Code
Section titled “Procedure Type or Procedure Code”These are an either/or choice — pick one, not both. Procedure Type lists your own Open Dental procedure categories; Procedure Code searches individual codes. Each has a Clear Selection link.
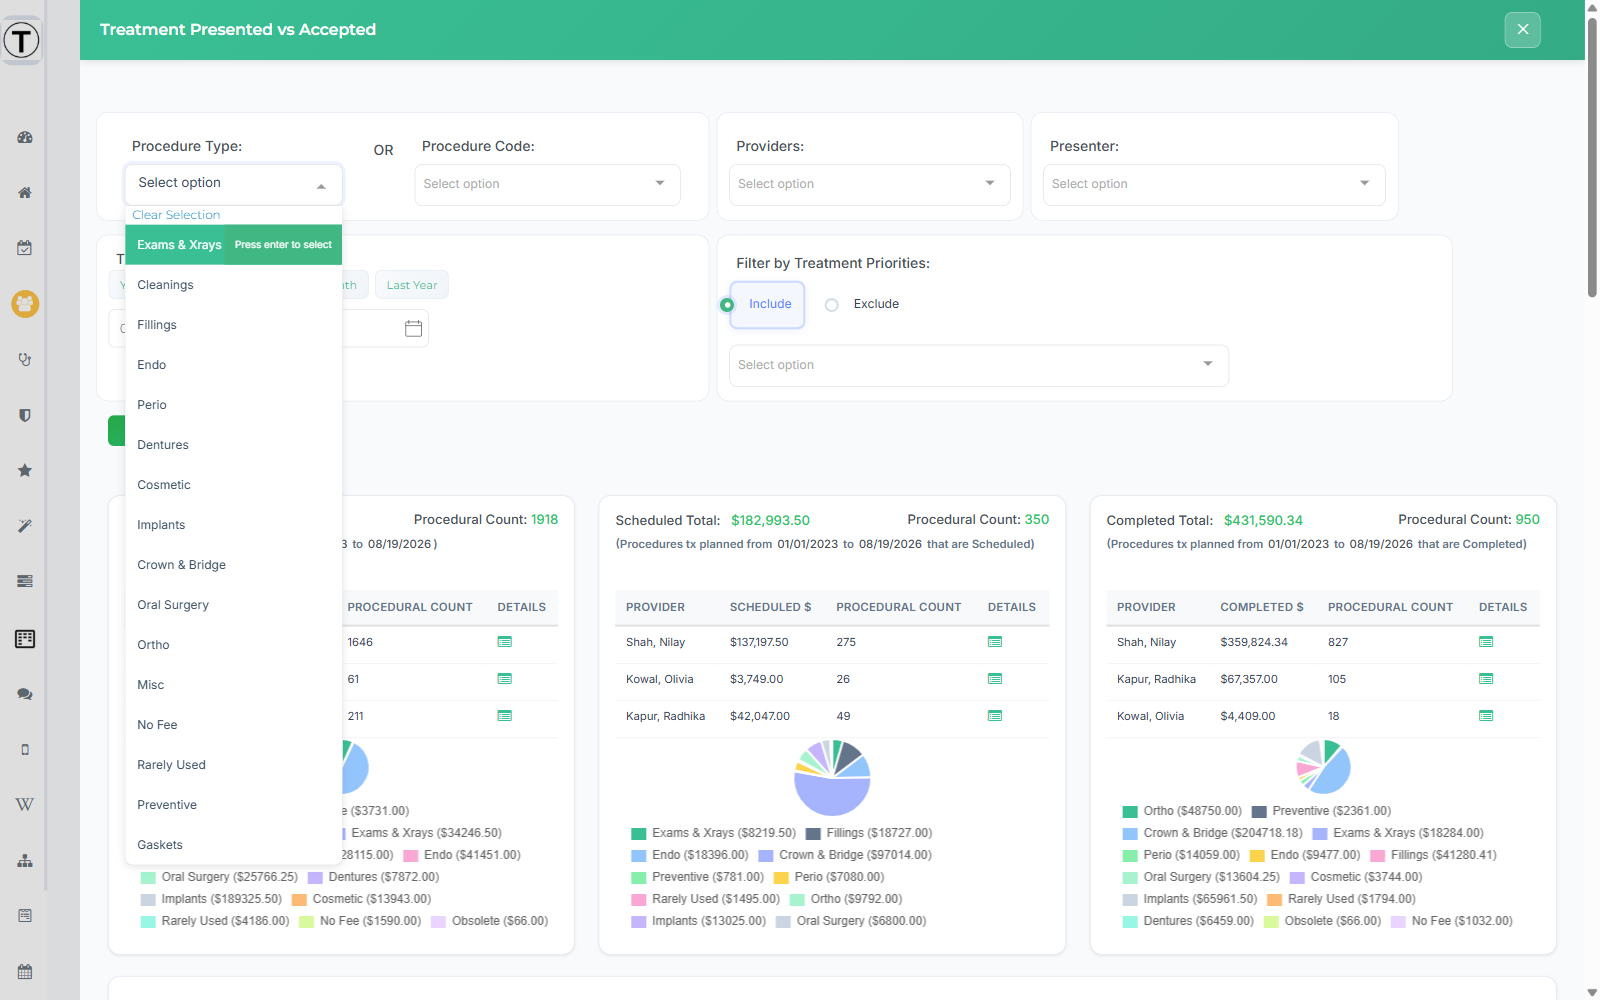
This is where most of the useful questions get answered. How many crowns did we plan last month, and how many actually got scheduled? — set Procedure Type to Crown & Bridge, Timeframe to Last Month, and read the three cards.
Quick sets
Section titled “Quick sets”Most offices filter this report by the same handful of codes every time — the hygienists’ diagnostic codes, or the restorative codes the doctor watches. Quick sets save those bundles so nobody has to re-pick them.
A quick set is a named group of procedure codes, shared by everyone at your office. They appear as chips above the filters:
- Select a chip to drop its codes into Procedure Code and re-run the report.
- Select it again to take those codes back out.
- Select a second chip to add its codes to the first, so you can combine two sets.
A chip is highlighted while all of its codes are selected.
To create one, pick the codes you want in Procedure Code, then select + Save current and give the set a name. The gear icon opens the list, where you can rename a set, point it at whatever codes are selected now, or delete it.
If your office hasn’t saved any yet, you’ll see a few suggested starters instead, filtered to codes your practice actually has. Using one works exactly like a saved set; saving it makes it yours to edit.
Providers and Presenter
Section titled “Providers and Presenter”Providers narrows to the provider the procedure is charted under. Presenter narrows to the person who presented the plan — useful for comparing how different team members do at the same conversation.
Timeframe
Section titled “Timeframe”Quick links for Yesterday, Last Week, Last Month, and Last Year, plus a custom date-range picker.
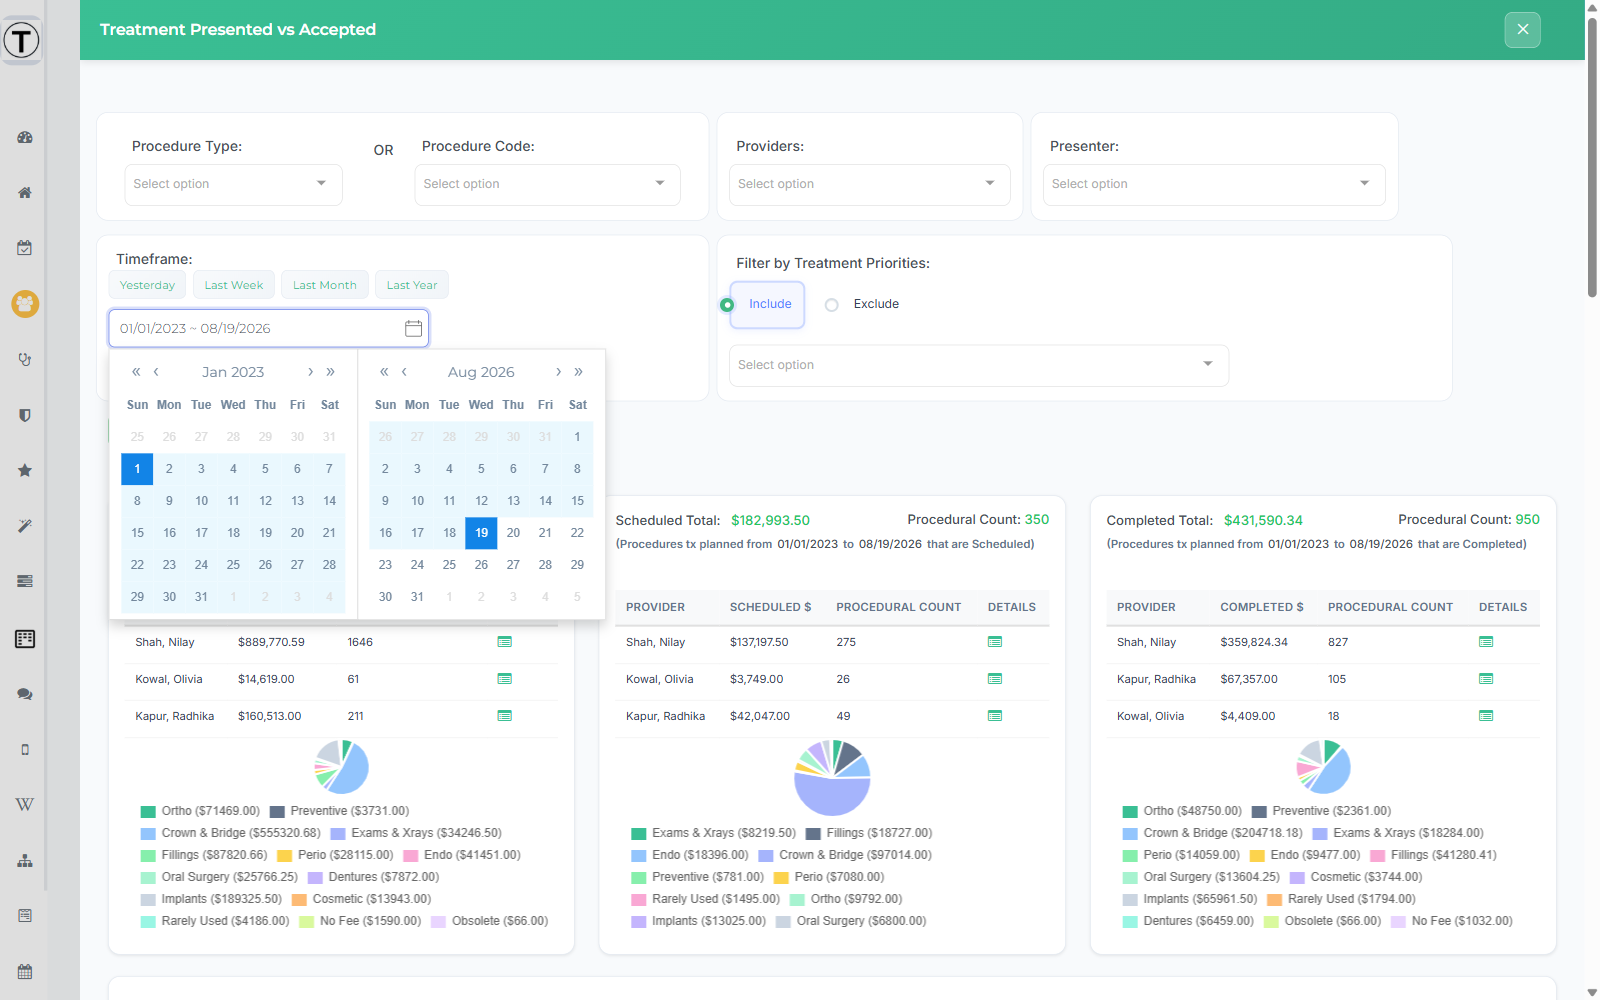
The timeframe filters on the date treatment was planned — not the date it was completed. Ask for July and you get everything diagnosed in July, including work completed in September.
A few limits apply: no future dates, a single range can’t exceed 5 years, and the earliest date you can pick is bounded by how many years of Open Dental history your site keeps (4 years by default).
Treatment Priorities
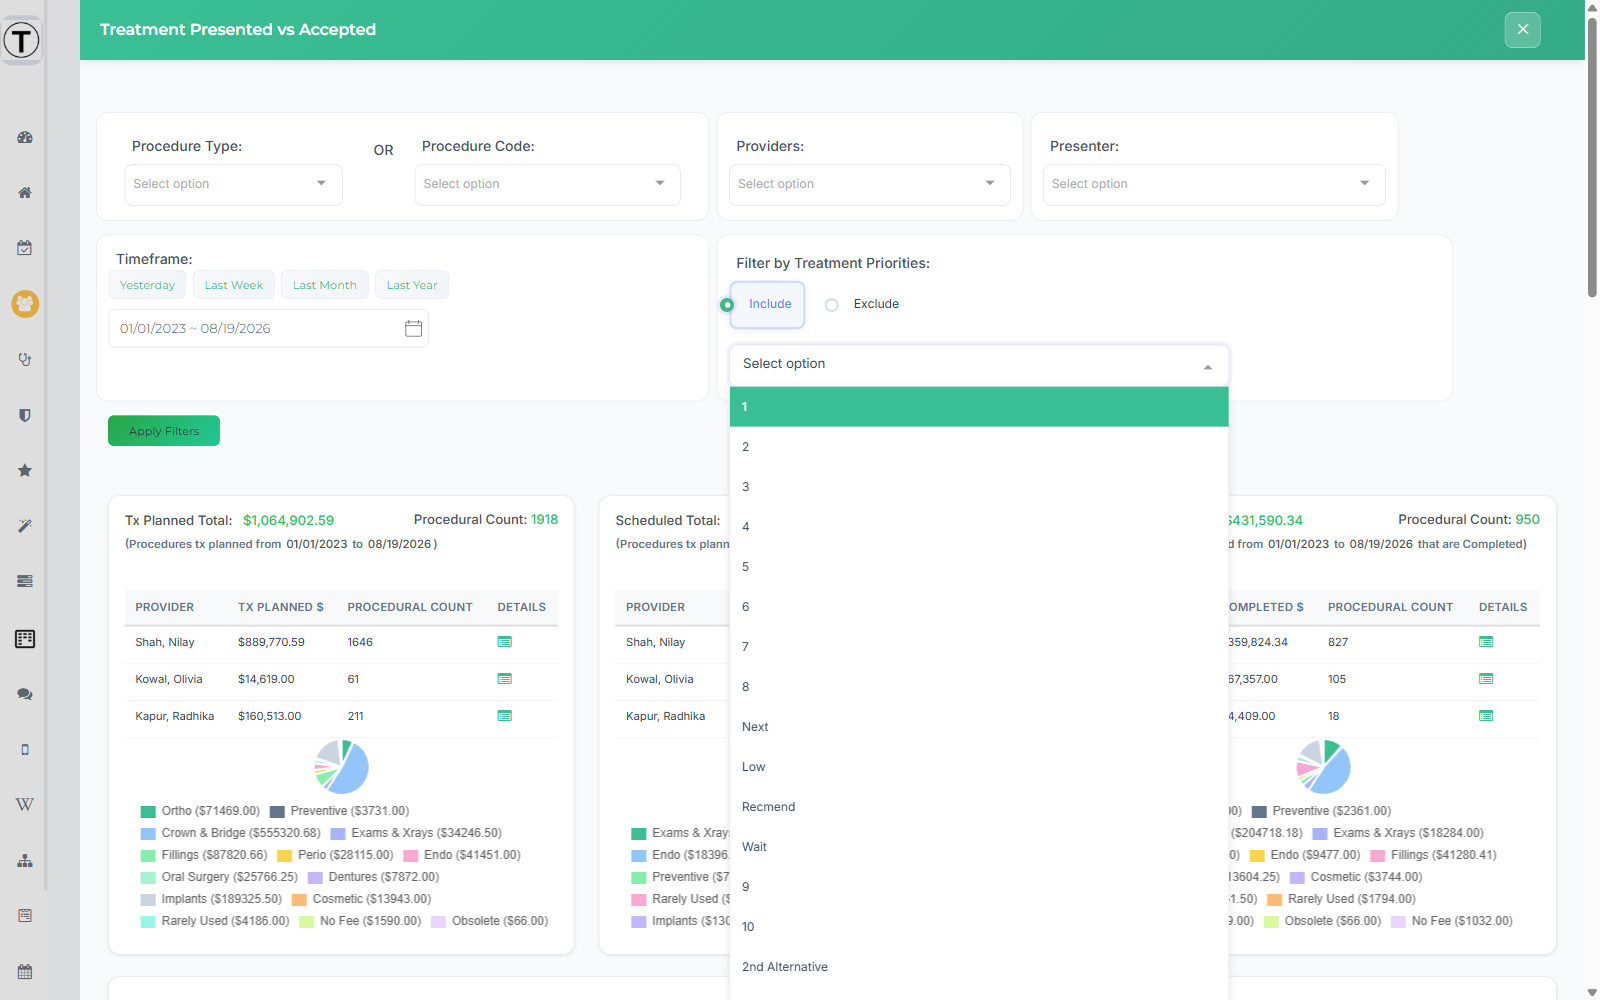
Section titled “Treatment Priorities”Choose Include or Exclude, then pick the priorities. Exclude is usually the more useful direction — it’s how you keep Rejected, Wait, and the 2nd/3rd/4th alternative plans from dragging down a number that’s supposed to measure real presented treatment.
Your acceptance percentage, month by month
Section titled “Your acceptance percentage, month by month”Scroll past the cards for a Year section — one per year in your timeframe — with a bar chart and a January-through-December table.
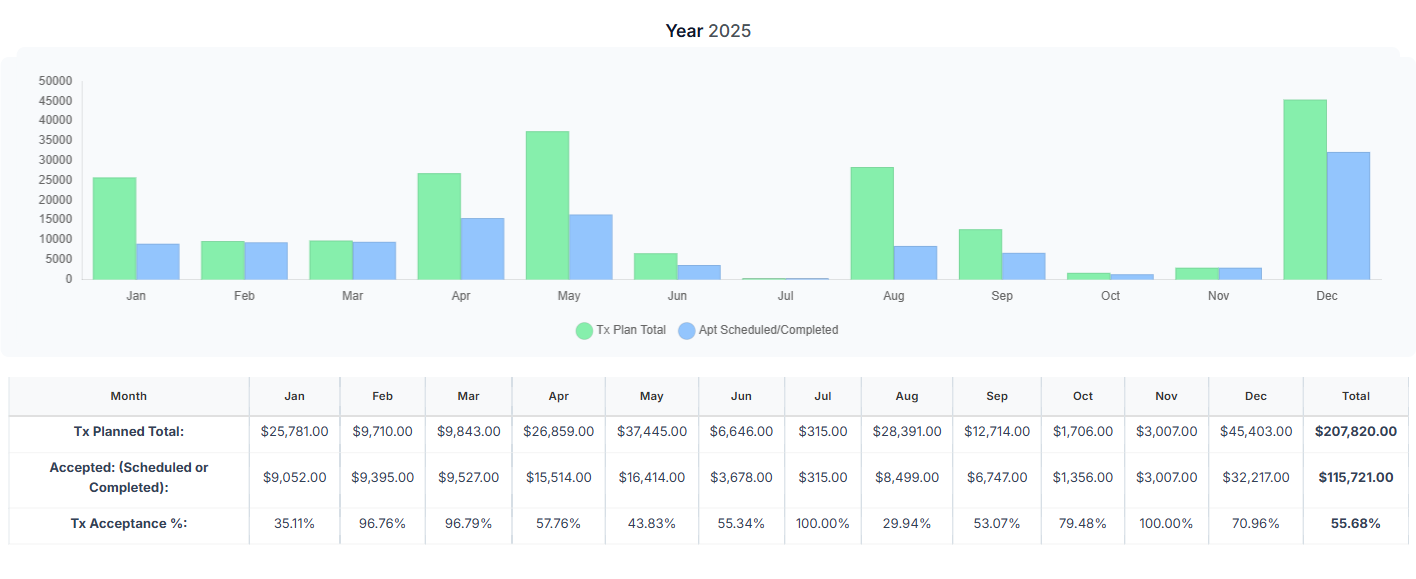
Three rows, plus a Total column:
- Tx Planned Total: — presented that month
- Accepted: (Scheduled or Completed): — of that, what got booked or done
- Tx Acceptance %: — the percentage, to two decimals
This is the only place acceptance appears as a percentage.
Because everything is bucketed by the date treatment was planned, a crown planned on 20 January and completed on 5 March lifts January’s acceptance, not March’s. Two consequences worth knowing:
- Past months keep improving. When an old plan finally gets scheduled, the month it was planned in goes up. Last month’s number is not final.
- The current month always looks low. Treatment diagnosed this week hasn’t had time to convert. Don’t read August’s number on 3 August and panic.
Questions this report can answer
Section titled “Questions this report can answer”- Which providers convert best on the same work? Filter to one Procedure Type and compare the three cards provider by provider.
- Who’s presenting well? Use the Presenter filter across a full quarter and compare acceptance.
- Which hygienist plans the most clear-aligner consults? Presenter + Procedure Code, over a long timeframe.
- How many crown & bridge units did we complete last quarter? Procedure Type + a custom range, then read the Completed Total card.
- What’s sitting unbooked right now? Open the Tx Planned details for each provider, sort by Status, and work the Unscheduled rows — turn them into tasks so the follow-up actually happens.
Why doesn’t my number match?
Section titled “Why doesn’t my number match?””The patient said yes, but it still shows Unscheduled”
Section titled “”The patient said yes, but it still shows Unscheduled””Acceptance is read from Open Dental appointments, not from intent. Until the planned procedure is attached to an appointment with a status of Scheduled or Completed, it isn’t accepted here. Schedule the appointment and attach the planned procedures to it, and the row moves on the next refresh.
”Tx Planned Total is lower than my Open Dental treatment plan report”
Section titled “”Tx Planned Total is lower than my Open Dental treatment plan report””Two deliberate exclusions. Zero-fee procedures never enter this report, and diagnostic and preventive codes are excluded — D0… and D1… — apart from sealants (D1351) and fluoride (D1206, D1208). If your Open Dental report counts exams, x-rays, and prophys, it will always read higher.
”The fee shown isn’t my office fee”
Section titled “”The fee shown isn’t my office fee””Every dollar in this report is a net fee. If the patient has primary insurance with a fee-schedule amount for that procedure, Teamio uses that amount minus any discounts. If there’s no insurance fee, or the procedure is marked Do Not Bill to Insurance, it uses your office fee minus discounts and discount-plan amounts. A crown you charge $1,400 for can legitimately appear as $936.
”Last month’s percentage changed on its own”
Section titled “”Last month’s percentage changed on its own””Expected — see the month-by-month section above. Everything buckets by the date treatment was planned, so an old plan that finally gets scheduled raises the month it was planned in, retroactively.
”Scheduled plus Completed doesn’t equal Tx Planned”
Section titled “”Scheduled plus Completed doesn’t equal Tx Planned””It isn’t supposed to. Both are subsets of Tx Planned. The gap between them is your unaccepted treatment — the number worth working.
”The Presenter filter is empty or missing people”
Section titled “”The Presenter filter is empty or missing people””Presenter comes from the saved Open Dental treatment plan’s assigned presenter. Plans that were never saved as a formal treatment plan, or saved without a presenter, have nothing to filter on.
”I can’t pick an older start date”
Section titled “”I can’t pick an older start date””The picker is bounded by how many years of Open Dental history your site retains — 4 years by default, which produces Start date cannot be more than 4 years ago. A single range also can’t exceed 5 years, and future dates aren’t allowed.
”It doesn’t match my emailed case-acceptance number”
Section titled “”It doesn’t match my emailed case-acceptance number””Different windows, same math. The panel opens on month-to-date; the case-acceptance figure in the automated email reports covers a rolling three-month window.
”Everything is empty”
Section titled “”Everything is empty””If the filters return nothing, each card says so — No Treatment Planned Data, No Scheduled Procedures, No Completed Procedures. Widen the timeframe or clear a filter.